- Skip to
- Infections
- Lockdown
- Health and lockdown heatmaps
- Risk threshold heatmaps
- Other health consequences

- Economic consequences
- Model Details

- 2022 will be better: Modelling Report
COVID-19 Pandemic Trade-offs: Version 3, September 2021
A report summarising Version 3 COVID-19 Pandemic Tradeoffs modelling, ‘2022 will be better’, accompanies this website.
This tool allows you to explore how COVID-19 policy responses (restrictions, vaccination roll-out, and border opening) impact future SARS-CoV-2 infection, hospitalisation and mortality rates, and the future probability of lockdowns. This Version 3 updates Version 2 in the following important ways:
- Including options for a higher virus reproduction rate (5, 6.5 and 8) given recent concerns about greater infectivity of Delta (e.g. CDC estimates range 5 to 9)
- Shorter duration from initially becoming infected to being infectious
- Removing previously lower chance of children being infected as seen pre-Delta; we now assume, consistent with global experience, that children as just as likely to be infected as adults
- Moving from vaccinated but infected people being 50% less likely to transmit the virus on, to a 25% reduction (range 0% to 50%) given recent evidence that the viral load in vaccinated but Delta-infected individuals is little different from unvaccinated Delta-infecteds.
- Mortality rates from Delta infections are now assumed to be two-fold higher (hospitalisation and ICU rates two-fold higher on an odds-scale) than for previous variants based on early UK and Candian results. Whilst we believe these are the best current working estimates, they are very uncertain. Therefore, users not convinced that Delta has two-fold higher virulence than previous variants may consider halving the number of deaths, hospitalisations and ICU admissions shown below. We will obviously update this important parameter as more data emerges.
These changes all mean that for any policy setting (e.g. vaccination coverage, triggers to lockdown, mask wearing) the expected number of infections (and hence morbidity and mortality), and the expected time in lockdown, is – unfortunately – worse than we estimated in Version 2 of this tool.
A co-published modelling report (PDF 9.0 MB) gives our interpretation and policy recommendations based on this Version 3.
We use the State of Victoria as the case study, but the findings can be broadly applied to other states and territories in Australia, New Zealand and other South Eastern Asian and Oceanic countries that are trying to use an elimination strategy before opening their open the borders. The findings may also be generalised further to countries that have not used an elimination strategy, but are considering how best to manage borders at varying levels of within-country immunity (be that through vaccination and / or natural infection).
This tool will allow the user to explore possible outcomes for the remainder of the current year, with increasing vaccination coverage, and then, in the year subsequent to border restrictions being lifted. By “borders open”, we mean when a substantial proportion of vaccinated in-bound travelers are allowed quarantine-free arrival – but there will always be a need for arrivals from some countries that have high infection rates, or new variants of concern, to go to formal managed quarantine (presumably at purpose-built facilities). Indeed, this Trade-offs tool can assist with deciding what that threshold might be, in directing high-risk arrivals to formal quarantine. The model allows for incursions of the virus through both leakages out of formal quarantine (4.5% per day up to opening the borders, 2.25% probability per day after opening borders), and from vaccinated but infected quarantine arrivals ‘slipping through’ at rates of 0.2, 1, or 5 per day.
You will see 216 scenarios presented in interactive tools below, for combinations of 3 in-country policy settings for when to tighten restrictions, 4 levels of vaccination coverage achieved before borders are opened, whether children (aged 5 to 17) are also vaccinated, expected vaccinated but infected arrivals after the borders open (0.2, 1 and 5 per day), and the reproductive rate of the virus (R0 of 5, 6.5 and 8).
For more information on these input variables, view our model details page.
Infections
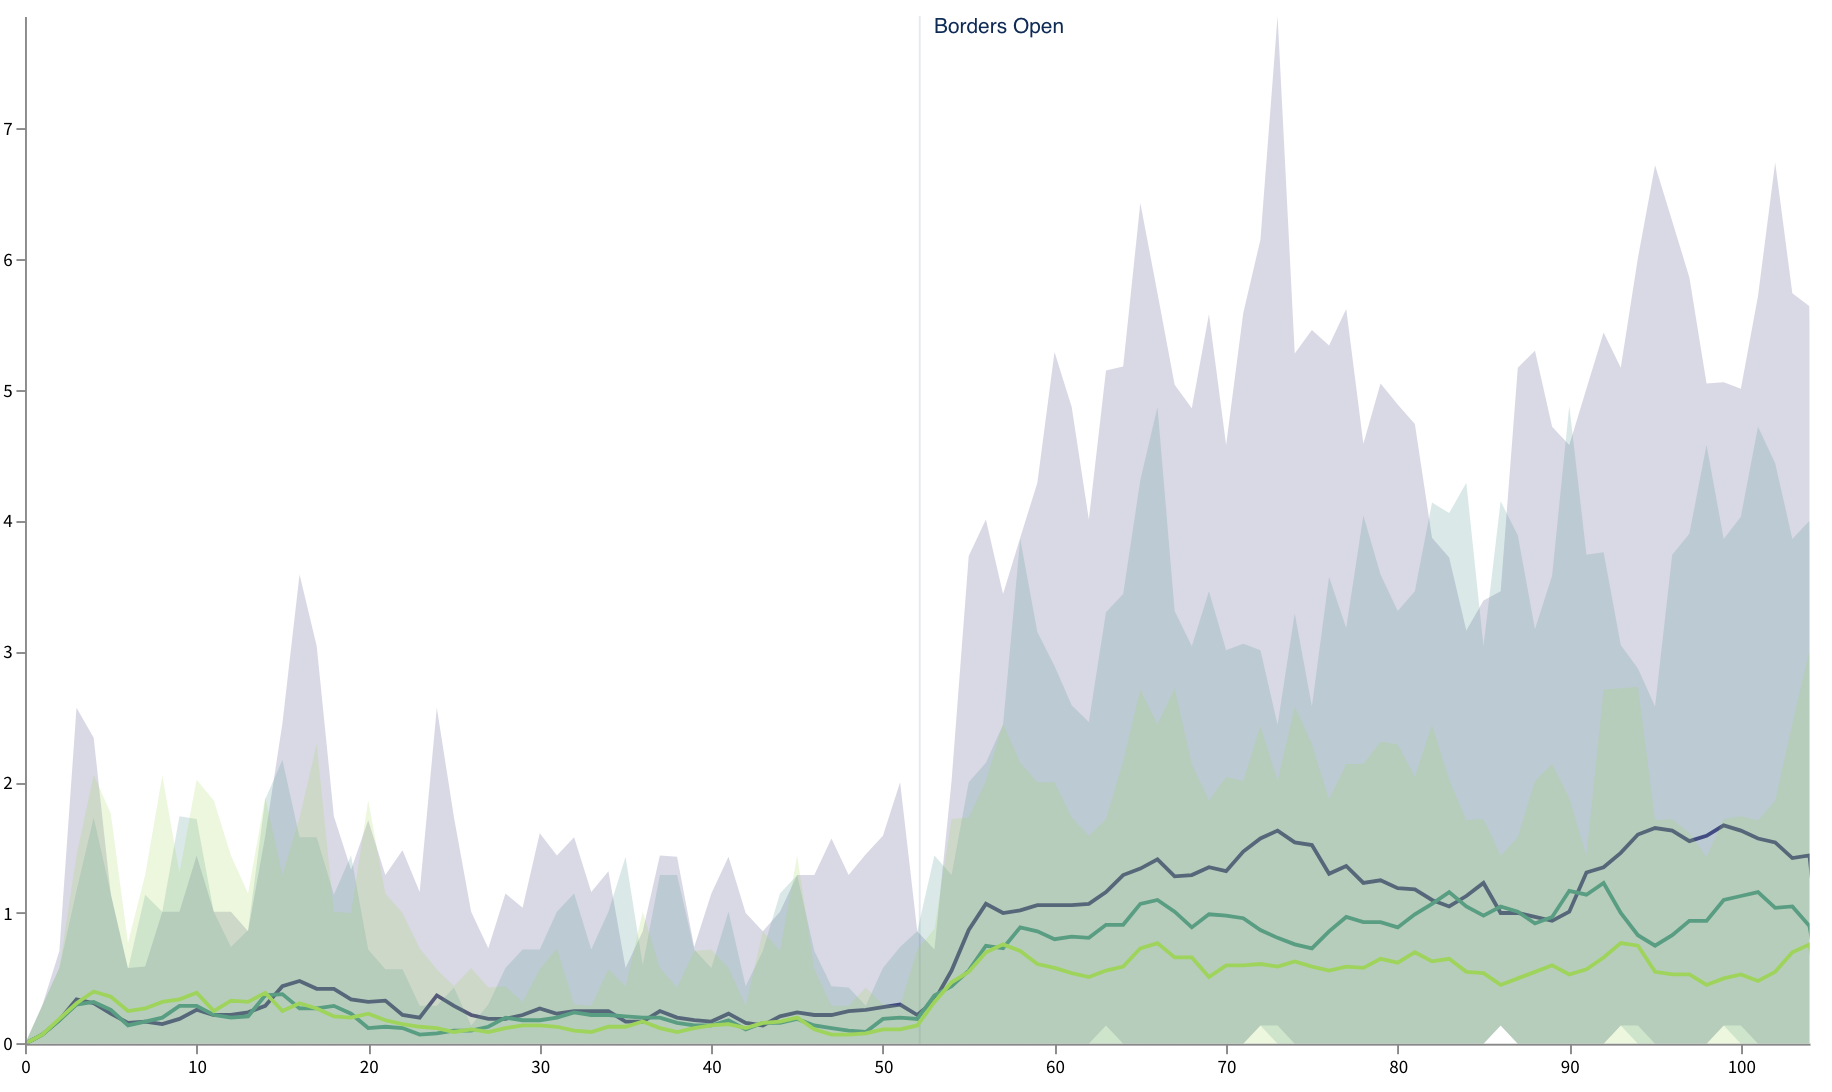
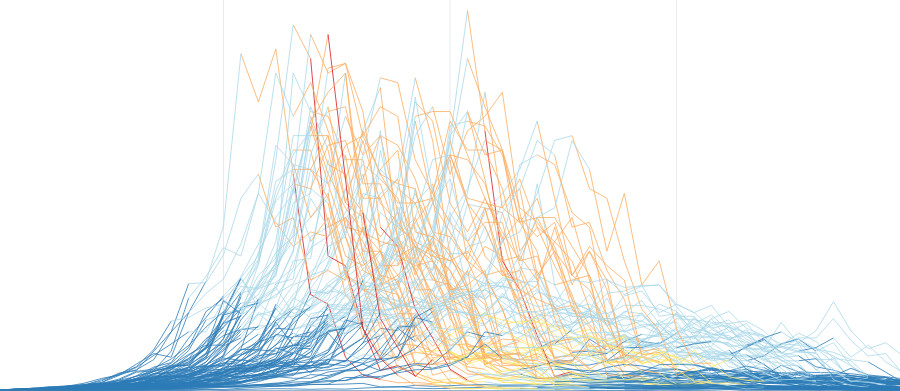
A basic measure of COVID-19 policy success is the extent to which it keeps the number of new infections manageable.
To model this, we ran 100 simulations of how the SARS-CoV-2 virus might spread through a population of 6 million people, for each scenario. The graph below shows the median (or average) daily infections across the 100 simulations of each scenario, along with a 90% uncertainty interval (the 5th and 95th percentiles).
Use the options to the left of (or below) the graph to explore how different scenarios affect the spread of the virus.
Lockdown restrictions
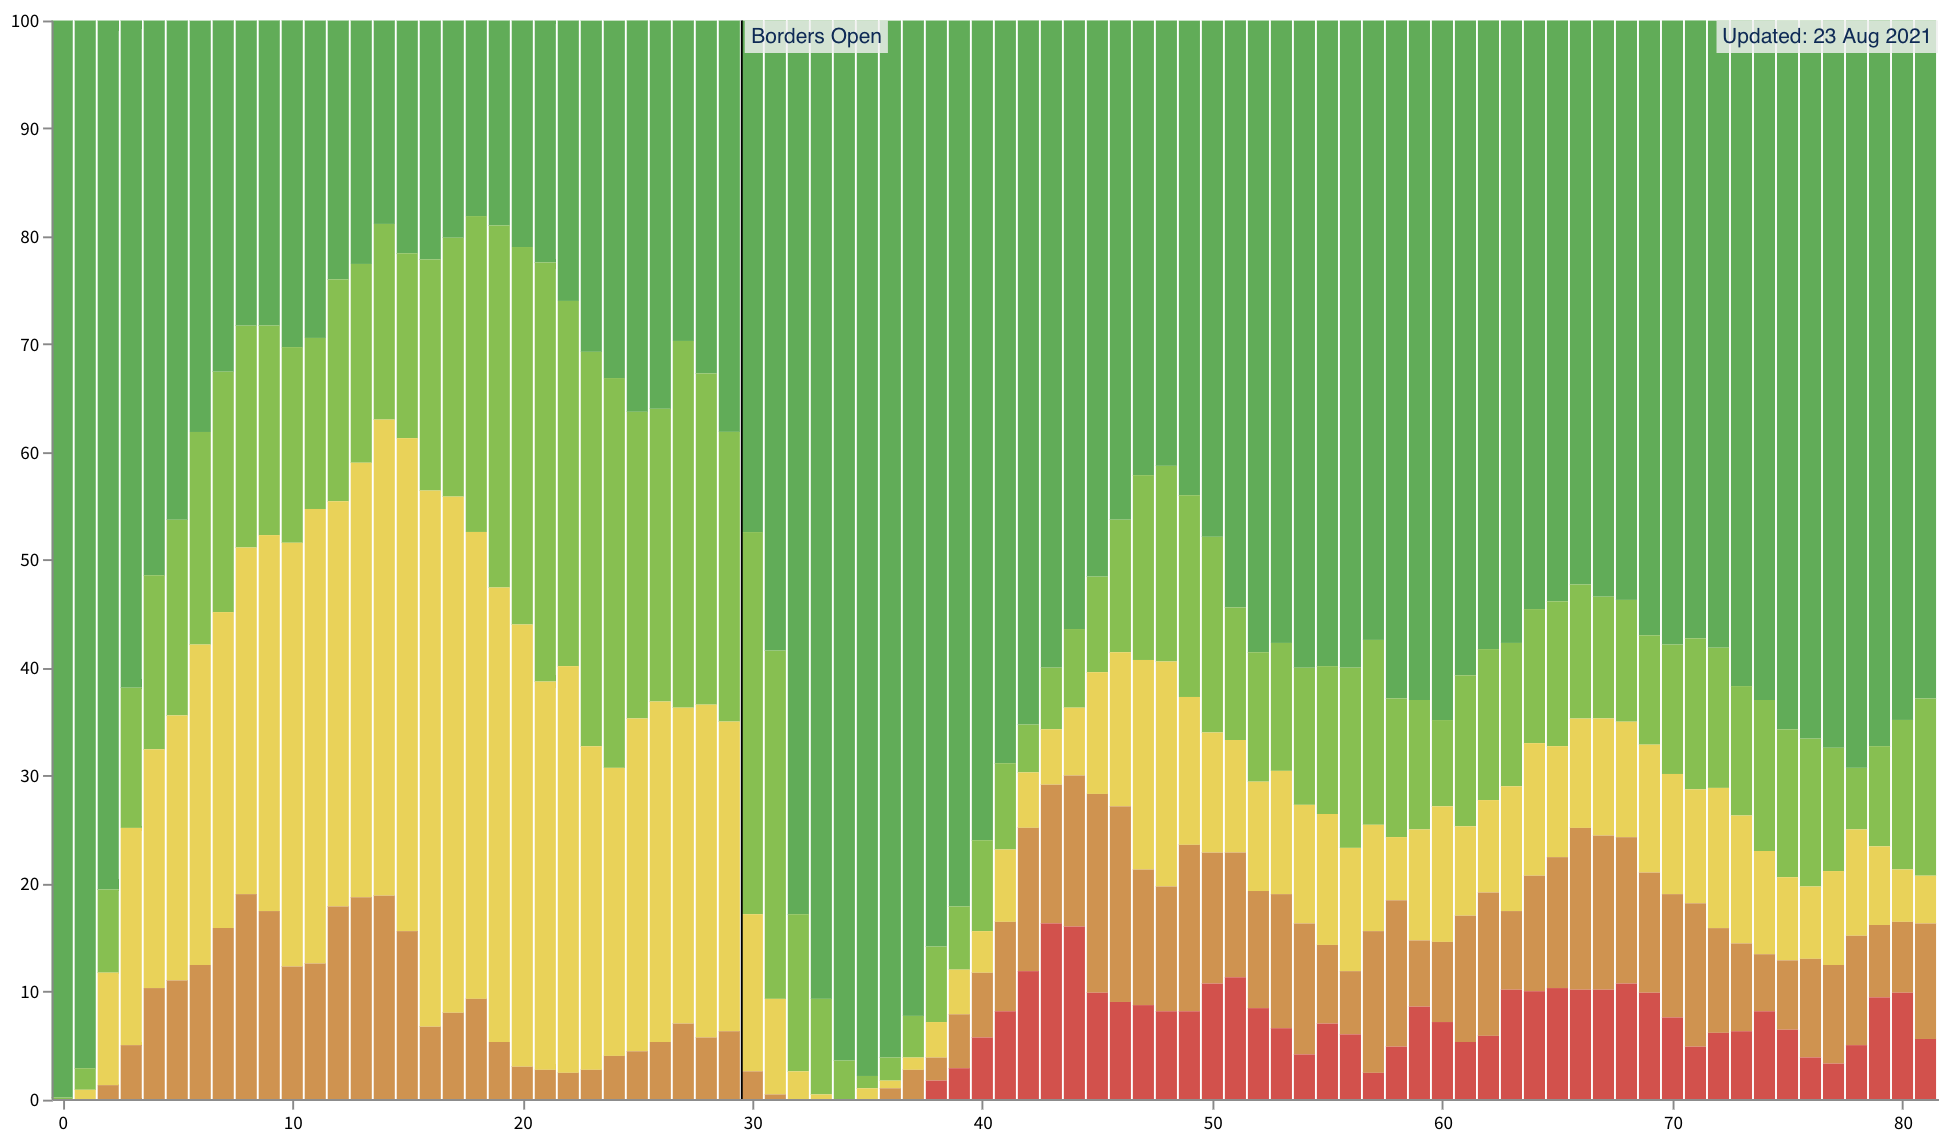
In each of the 100 simulations, the model also tracks which stage of restrictions is in place each day (Stage 1 being near-normal, up to Stage 4 with strong stay at home orders, i.e. a hard lockdown). The graph below shows the percentage prevalence of each stage of restrictions, by week, across 100 simulations of the chosen scenario.
Use the options to the left of (or below) the graph to explore how different scenarios affect the enforcement of lockdown restrictions over time.
For more detail, click below to view all 100 simulations of each scenario, coloured by restriction stage in use depending on the policy setting (elimination, tight suppression, loose suppression, and extra loose suppression).
If you are interested in the details of the model, these are included on a separate page.
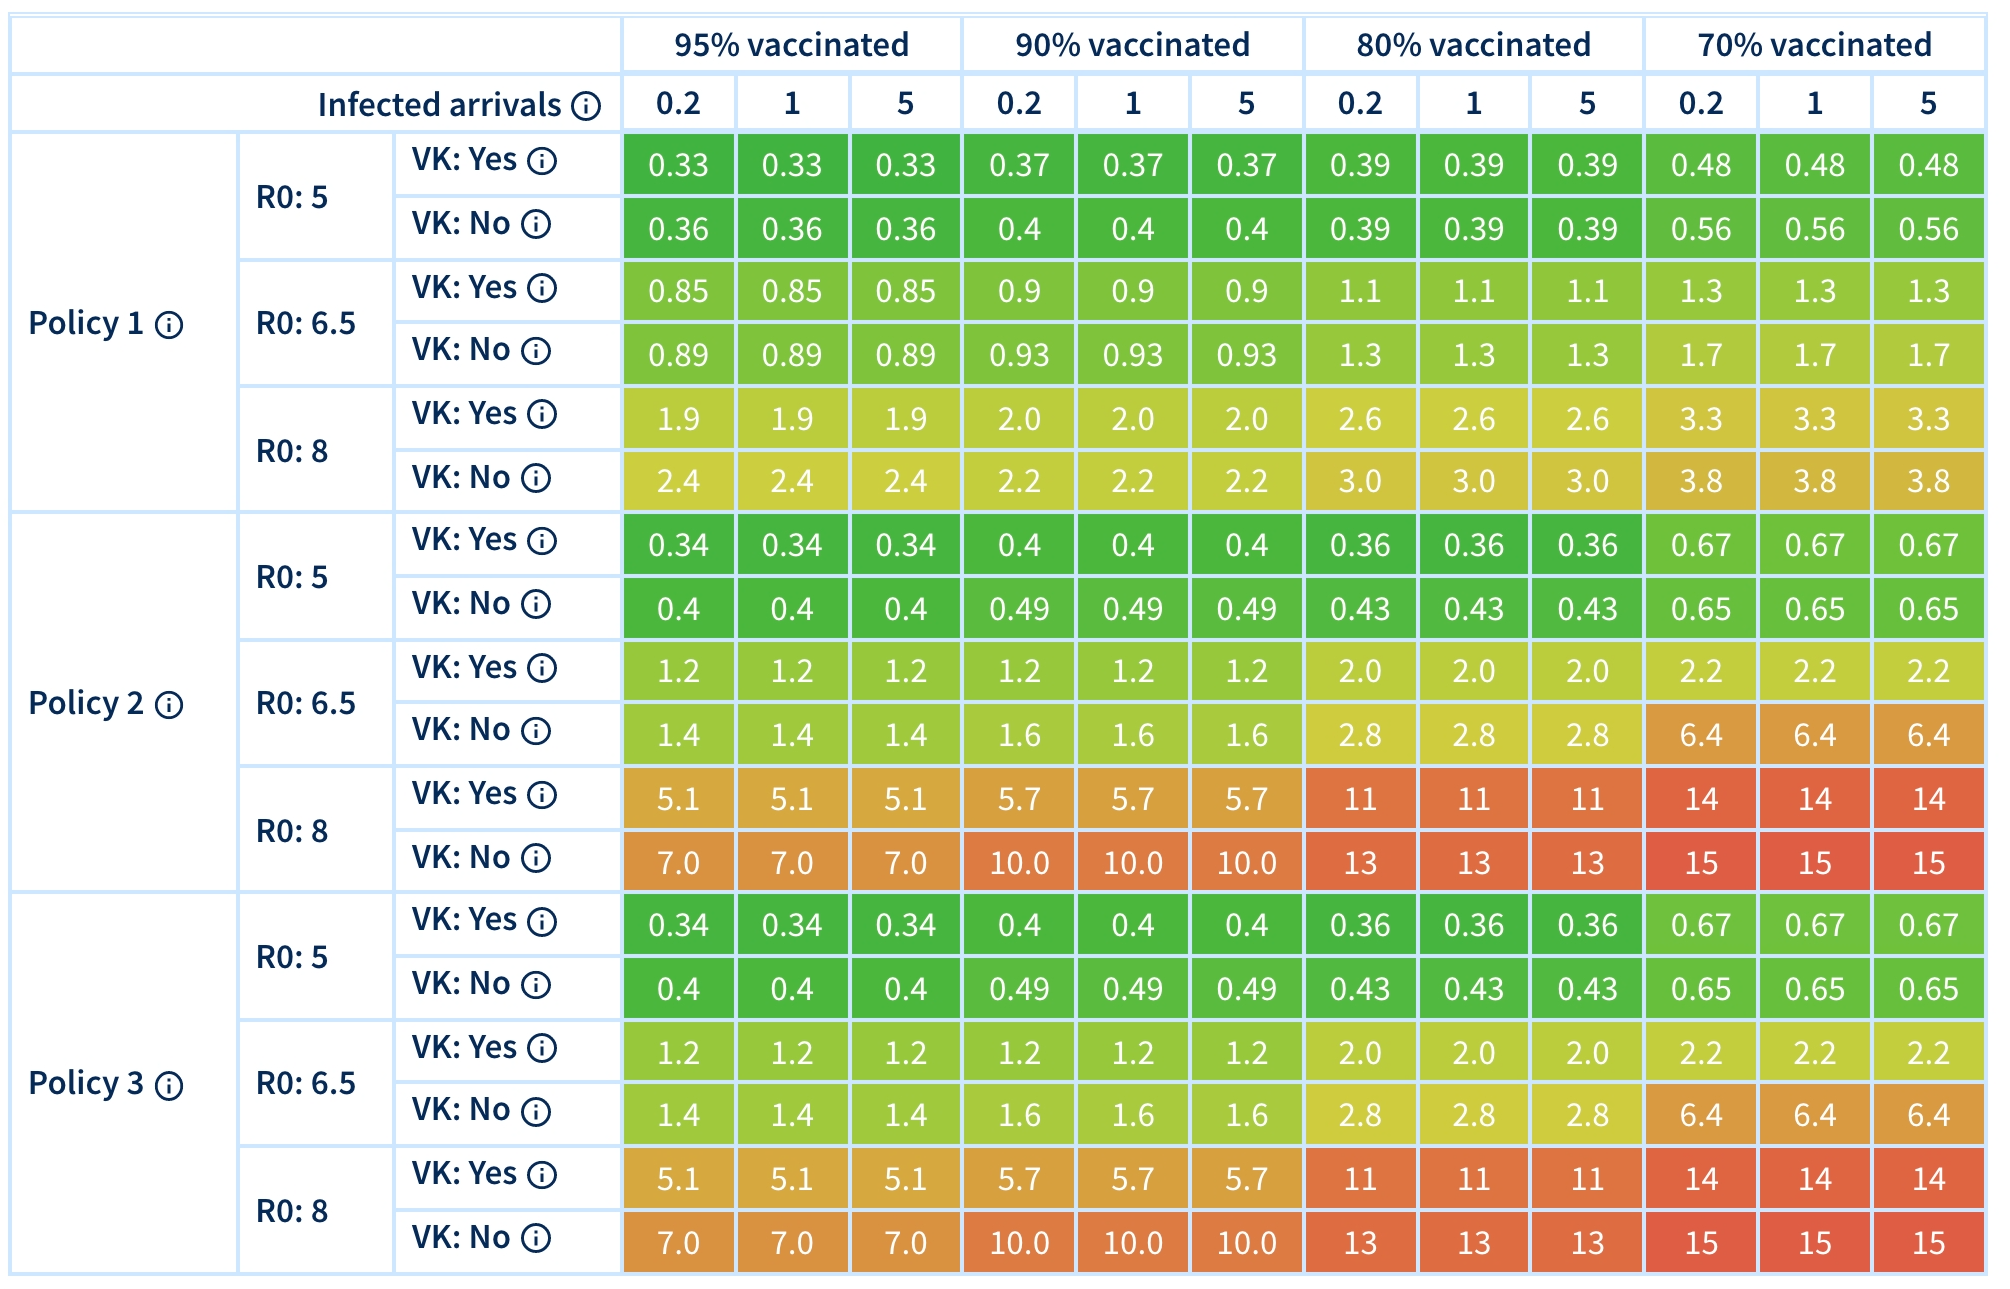
Heatmaps of infections, hospitalisations, ICU admissions, deaths and time in lockdown
Below are two heatmaps. The first shows (depending on which option you select) the average number of daily infections, the yearly SARS-CoV-2 deaths and the yearly SARS-CoV-2 hospitalisation (for a population the size and make-up of Victoria). Deaths are estimated using pre-Delta variant fatality risk ratios from the Institute for Health Metrics and Evaluation infection, which are doubled for increased virulence of Delta. Hospitalisation and ICU admission rates are estimated using the respective rates observed throughout the Victorian second wave, doubled (on odds scale) again for increased virulence of Delta.
The second heatmap shows the proportion of time in Stage 3 (soft lockdown) and Stage 4 (hard lockdown) for all scenarios.
For both heatmaps, you can also select whether you want to see:
- the period before borders open: when an infection escaping from quarantine has a probability of 4.5% per day); or
- the period after borders open: when infections are still escaping from quarantine at a rate of 2.25% per day, and vaccinated infected arrivals occurring at the rate indicated for each scenario.
For both heatmaps, if you hover over a cell you will be shown the 90% simulation interval, due to both stochastic uncertainty and input parameter uncertainty (e.g. about vaccination effectiveness).
| 95% vaccinated | 90% vaccinated | 80% vaccinated | 70% vaccinated | |||||||||||
|---|---|---|---|---|---|---|---|---|---|---|---|---|---|---|
|
Infected arrivals
Expected daily arrivals
into Victoria of vaccinated but infected travellers |
0.2 | 1 | 5 | 0.2 | 1 | 5 | 0.2 | 1 | 5 | 0.2 | 1 | 5 | ||
|
Policy 1
< 6 months:Moderate elimination
6-12 months:Moderate elimination
12+ months:Tight suppression
|
R0: 5 |
VK: Yes
Yes:Adults & children vaccinated
No:Adults only vaccinated
|
||||||||||||
|
VK: No
Yes:Adults & children vaccinated
No:Adults only vaccinated
|
||||||||||||||
| R0: 6.5 |
VK: Yes
Yes:Adults & children vaccinated
No:Adults only vaccinated
|
|||||||||||||
|
VK: No
Yes:Adults & children vaccinated
No:Adults only vaccinated
|
||||||||||||||
| R0: 8 |
VK: Yes
Yes:Adults & children vaccinated
No:Adults only vaccinated
|
|||||||||||||
|
VK: No
Yes:Adults & children vaccinated
No:Adults only vaccinated
|
||||||||||||||
|
Policy 2
< 6 months:Moderate elimination
6-12 months:Tight suppression
12+ months:Loose suppression
|
R0: 5 |
VK: Yes
Yes:Adults & children vaccinated
No:Adults only vaccinated
|
||||||||||||
|
VK: No
Yes:Adults & children vaccinated
No:Adults only vaccinated
|
||||||||||||||
| R0: 6.5 |
VK: Yes
Yes:Adults & children vaccinated
No:Adults only vaccinated
|
|||||||||||||
|
VK: No
Yes:Adults & children vaccinated
No:Adults only vaccinated
|
||||||||||||||
| R0: 8 |
VK: Yes
Yes:Adults & children vaccinated
No:Adults only vaccinated
|
|||||||||||||
|
VK: No
Yes:Adults & children vaccinated
No:Adults only vaccinated
|
||||||||||||||
|
Policy 3
< 6 months:Moderate elimination
6-12 months:Tight suppression
12+ months:Bare suppression
|
R0: 5 |
VK: Yes
Yes:Adults & children vaccinated
No:Adults only vaccinated
|
||||||||||||
|
VK: No
Yes:Adults & children vaccinated
No:Adults only vaccinated
|
||||||||||||||
| R0: 6.5 |
VK: Yes
Yes:Adults & children vaccinated
No:Adults only vaccinated
|
|||||||||||||
|
VK: No
Yes:Adults & children vaccinated
No:Adults only vaccinated
|
||||||||||||||
| R0: 8 |
VK: Yes
Yes:Adults & children vaccinated
No:Adults only vaccinated
|
|||||||||||||
|
VK: No
Yes:Adults & children vaccinated
No:Adults only vaccinated
|
||||||||||||||
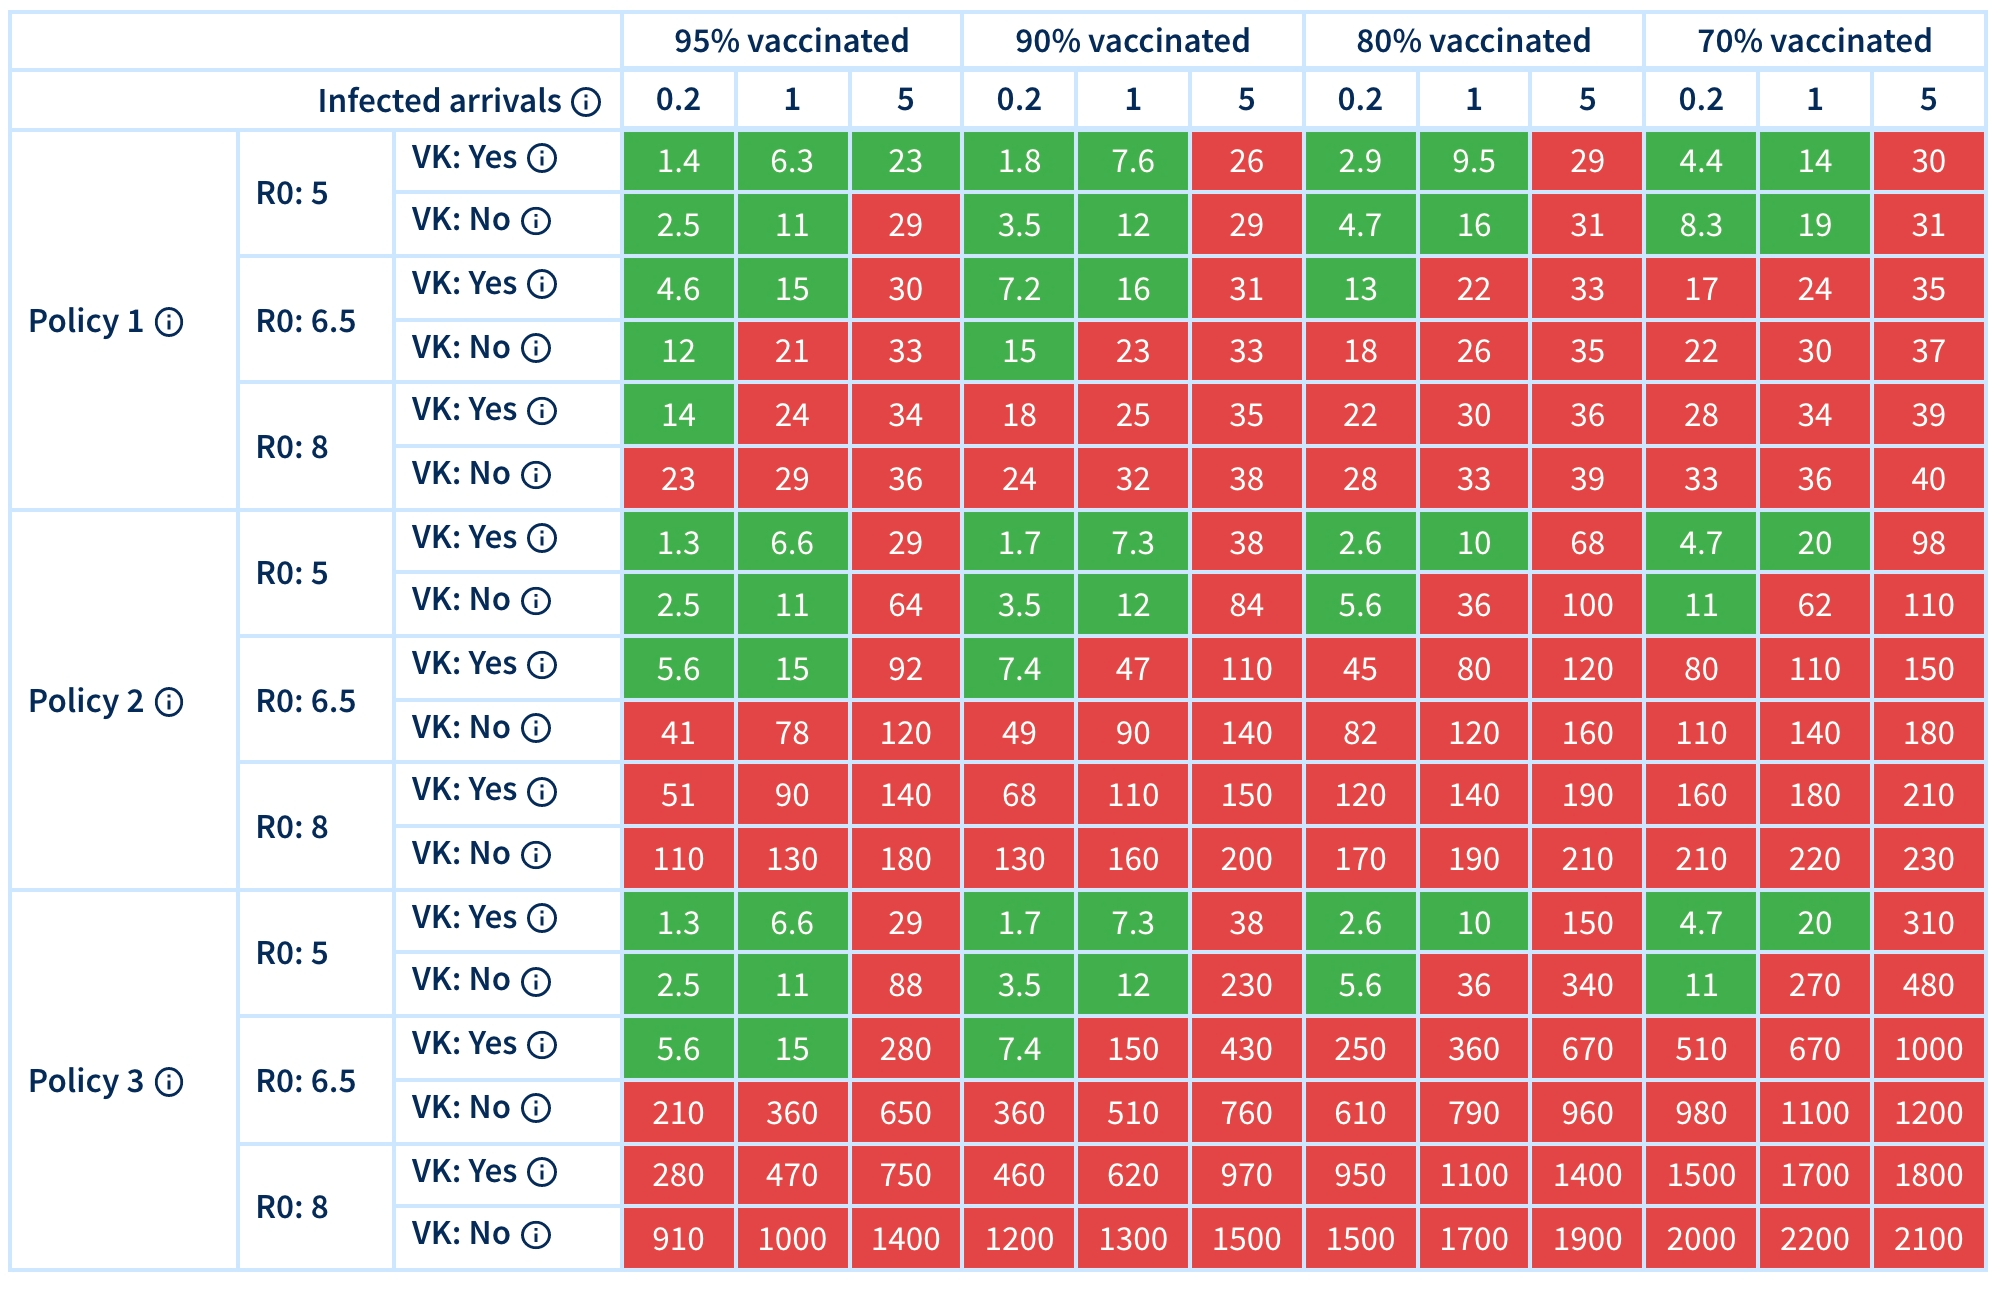
Interactive heatmap of settings that meet your risk threshold
Below is an interactive heatmap – just for the year after borders open – where you select your ‘risk threshold’ of the maximum average infections per day, maximum deaths in a year, maximum hospitalisations in a year, maximum ICU admissions per year, and maximum percentage of time in lockdown that you are willing to tolerate.
The cells colored green are beneath your threshold (on all five criteria), and the settings you would use if you were in charge of a jurisdiction. For example, vaccination coverage might have reached 80% for adults only by the time we have committed to opening the borders, and you think the true R0 might be 6.5. So you see which settings on ‘vaccinated but infected arrivals’ per day keeps you in the green, and set your jurisdictions border policy to match this. That is, you allow a number and mix of international arrivals without quarantine that keeps you in the green, and arrivals from countries with higher risk still have to go to (purpose-built) quarantine facilities.
The estimated number of vaccinated but infected arrivals per day is perhaps not intuitive. In anticipation of this, we have built a calculator that allows you to estimate this parameter as a function of more intuitive quantities: the number of travellers, and the prevalence of vaccinations and circulating virus in their countries of origin. We assume all such arrivals eligible for quarantine-free arrival must be vaccinated and PCR-tested before travel.
| 95% vaccinated | 90% vaccinated | 80% vaccinated | 70% vaccinated | |||||||||||
|---|---|---|---|---|---|---|---|---|---|---|---|---|---|---|
|
Infected arrivals
Expected daily arrivals
into Victoria of vaccinated but infected travellers |
0.2 | 1 | 5 | 0.2 | 1 | 5 | 0.2 | 1 | 5 | 0.2 | 1 | 5 | ||
|
Policy 1
< 6 months:Moderate elimination
6-12 months:Moderate elimination
12+ months:Tight suppression
|
R0: 5 |
VK: Yes
Yes:Adults & children vaccinated
No:Adults only vaccinated
|
||||||||||||
|
VK: No
Yes:Adults & children vaccinated
No:Adults only vaccinated
|
||||||||||||||
| R0: 6.5 |
VK: Yes
Yes:Adults & children vaccinated
No:Adults only vaccinated
|
|||||||||||||
|
VK: No
Yes:Adults & children vaccinated
No:Adults only vaccinated
|
||||||||||||||
| R0: 8 |
VK: Yes
Yes:Adults & children vaccinated
No:Adults only vaccinated
|
|||||||||||||
|
VK: No
Yes:Adults & children vaccinated
No:Adults only vaccinated
|
||||||||||||||
|
Policy 2
< 6 months:Moderate elimination
6-12 months:Tight suppression
12+ months:Loose suppression
|
R0: 5 |
VK: Yes
Yes:Adults & children vaccinated
No:Adults only vaccinated
|
||||||||||||
|
VK: No
Yes:Adults & children vaccinated
No:Adults only vaccinated
|
||||||||||||||
| R0: 6.5 |
VK: Yes
Yes:Adults & children vaccinated
No:Adults only vaccinated
|
|||||||||||||
|
VK: No
Yes:Adults & children vaccinated
No:Adults only vaccinated
|
||||||||||||||
| R0: 8 |
VK: Yes
Yes:Adults & children vaccinated
No:Adults only vaccinated
|
|||||||||||||
|
VK: No
Yes:Adults & children vaccinated
No:Adults only vaccinated
|
||||||||||||||
|
Policy 3
< 6 months:Moderate elimination
6-12 months:Tight suppression
12+ months:Bare suppression
|
R0: 5 |
VK: Yes
Yes:Adults & children vaccinated
No:Adults only vaccinated
|
||||||||||||
|
VK: No
Yes:Adults & children vaccinated
No:Adults only vaccinated
|
||||||||||||||
| R0: 6.5 |
VK: Yes
Yes:Adults & children vaccinated
No:Adults only vaccinated
|
|||||||||||||
|
VK: No
Yes:Adults & children vaccinated
No:Adults only vaccinated
|
||||||||||||||
| R0: 8 |
VK: Yes
Yes:Adults & children vaccinated
No:Adults only vaccinated
|
|||||||||||||
|
VK: No
Yes:Adults & children vaccinated
No:Adults only vaccinated
|
||||||||||||||
Other Health Consequences
Health adjusted life years (HALYs)
Health adjusted life years (HALYs) for scenarios are coming soon – factoring in both the direct health consequences of SARS-CoV-2 (including long-COVID) and the indirect health consequences of lockdowns. For our previous estimates of HALYs lost by response strategy during the (as planned) vaccine rollout, go to our previous version of this tool, and see our paper in JAMA Health Forum.
Economic impacts
As with HALYs, the estimated health expenditure and GDP consequences of scenarios are coming soon. In the meantime, see our previous estimates of cost impacts by response strategy during the (as planned) vaccine rollout at the previous version of this tool, and see our paper in JAMA Health Forum.
To learn more about this modelling, please see the Model Details page.
Contributors
- The data visualisations and interface for this tool were developed by Luke Thorburn and Hassan Andrabi.
- The modelling was led by Dr Tim Wilson, assisted by Haifeng Zhao and Sachith Seneviratne. The original agent-based model was built by Dr Jason Thompson, assisted by Profs Rod McClure, Mark Stevenson and Tony Blakely. The integrated epidemiological and economic model (proportional multistate lifetable) is a collaboration between the University of Melbourne and the Institute of Health Metrics and Evaluation (University of Washington), with key contributions from: Prof Abie Flaxman and Mr James Collins (IHME); Drs Rob Moss, Nic Geard, Patrick Andersen and Tim Wilson (University of Melbourne), assisted by all members of the Population Interventions Unit (Drs Driss Ait Ouakrim and Laxman Bablani, and Profs Vijaya Sundararajan and Tony Blakely).
- The determination of which diseases and conditions are impacted by COVID-19 restrictions, and with what magnitude, was undertaken by Dr Driss Ait Ouakrim, Ms Ameera Katar, Mr Patrick Abraham, Dr Natalie Carvalho and Prof Nathan Grills.
- Overall leadership of the body of work was by Prof Tony Blakely.
- Web hosting and technical support was provided by Grace Dong and Dr Melissa Makin.
- We acknowledge a generous anonymous philanthropic grant, through Advancement, that enabled this project.
Contact Details
Please direct media or other enquiries about this research to the Population Interventions Unit at the following address.