This is the March 2021 version of this tool. For the September 2021 version that includes border openings, please go HERE.


COVID-19 Pandemic Trade-offs: Version 1, March 2021
A tool for exploring how COVID-19 policy responses (restrictions, vaccination roll-out, and border opening) impact future SARS-CoV-2 infection rates, health impacts (in health-adjusted life years) and economic impacts (health expenditure, GDP loss).
This tool allows you to explore how SARS-CoV-2 infection rates, health impacts (in health-adjusted life years) and economic impacts (health expenditure and GDP loss) vary by
- which strategy society pursues (aggressive elimination, moderate elimination, tight suppression or loose suppression), and
- whether that strategy is held steady over time, or relaxed as vaccination coverage increases.
In addition to these strategy choices, you can also set values for what you think might be the vaccine uptake, the efficacy of the vaccines at reducing transmission, and the unmitigated reproduction rate of the virus strains in circulation.
View the slides from the launch presentation
Read a walk-through
Infections
A basic measure of whether a COVID-19 policy response is successful is the extent to which it keeps the number of new infections manageable.
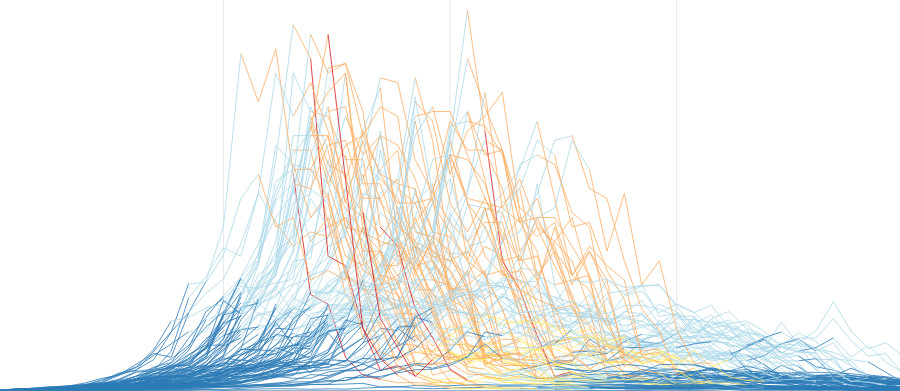
To model this, we ran 100 simulations of how the SARS-CoV-2 virus might spread through a population of 6 million people, for each of 648 different scenarios. The graph below shows the median daily infections across the 100 simulations of each scenario, along with a 90% uncertainty interval (the 5th and 95th percentiles).
Use the options to the left of (or below) the graph to explore how different scenarios affect the spread of the virus.
In each of the 100 simulations, the model also tracks which stage of restrictions is in place each day, but this is not visible on the above graph. Click below to view all 100 simulations of each scenario, coloured by restriction stage.
If you are interested in the details of the model, these are included on a separate page.
In particular, you might be interested to know:
Unintended consequences
Imposing restrictions on society can help limit the spread of SARS-CoV-2, but it also causes unintended health and economic consequences.
Health impacts
Research suggests that ‘lockdowns’ (i.e. Stage 3 and 4 restrictions) increase anxiety, depression, self-harm, and intimate partner violence, but also decrease road traffic injuries. In order to compare these health outcomes on a common scale, we use health-adjusted life years, or HALYs.
HALYs
Health adjusted life years (HALYS) are life years remaining to be lived, in a given time period or over each person’s remaining lifetime, weighted by [1 minus morbidity]. The morbidity is that due to COVID-19, other diseases included in the model, and the background expected morbidity for each sex and age group.
The HALY changes (compared with ‘No COVID-19’ scenario) are output for:
- Both the direct SARS-CoV-2 impacts (mostly premature mortality, but also morbidity among those people not dying of SARS-CoV-2), AND estimated HALYs due to changes in diseases resulting indirectly from COVID-19 policy responses (i.e. time in stages 3 and 4 or lockdown), including: road traffic injury; self-harm; anxiety; and depression.
- Coming soon, we will also include changes in the risk factor ‘intimate partner violence’ that leads to further changes in depression, and also changes in inter-personal violence harm.
- In future modelling, we aim to also include the long-run health impacts of reduced physical activity. Impacts of Stage 3 and 4 restrictions (lockdowns) on delayed cancer screening and presentation for other non-communicable diseases (e.g. cardiovascular disease) was beyond our scope.
- Only changes that occur during the year simulated, with the exception of deaths for which lost future HALYs are also counted.
Below are the expected health impacts of each strategy according to our model.
Economic impacts
Below (coming soon) are the estimated health expenditure consequences of SARS-CoV-2 cases in the health system, and changes in health expenditure for the other diseases impacted by stage 3 and 4 lockdowns. Also shown will be the GDP impacts, estimated using Treasury estimates of the GDP consequences of stages of lockdown multiplied by the percentage of time spent in each stage for each modelled scenario.
Which policy is optimal?
Below (coming soon) will be an analysis of which of the four policy responses (aggressive elimination, moderate elimination, tight or loose suppression) is optimal using a cost effectiveness approach called ‘net monetary benefit’. This approach is from either a health-system only perspective—which assumes healthcare expenditure is the only relevant financial cost—or a partial societal perspective, which includes GDP losses. The graph will show the probability that each policy response is ‘optimal’ (i.e. has the highest net monetary benefit – or with COVID-19 the least net monetary loss) for varying ‘willingness to pay’ for a HALY.
From a health system perspective, if we were deciding whether a new drug was cost-effective, our threshold is as a rule of thumb about $60,000 per HALY (i.e. roughly a country’s GDP per capita per HALY). From a partial societal perspective, there are not really such rules of thumb – although often revealed willingness to pay per HALY is higher (hence we include up to $500,000 on the x-axis). For this type of analysis, the standard (that we follow) is a lifetime perspective (i.e. all changes in HALYs and health expenditure (and additionally GDP for the partial societal perspective) for the remainder of the population’s lifespan), each discounted at 3% per year.
To learn more about this modelling, please see the Model Details page.
Contributors
- The data visualisations and interface for this tool were developed by Luke Thorburn.
- The modelling was led by Dr Tim Wilson, assisted by Haifeng Zhao and Sachith Seneviratne. The original agent-based model was built by Dr Jason Thompson, assisted by Profs Rod McClure, Mark Stevenson and Tony Blakely. The integrated epidemiological and economic model (proportional multistate lifetable) is a collaboration between the University of Melbourne and the Institute of Health Metrics and Evaluation (University of Washington), with key contributions from: Prof Abie Flaxman and Mr James Collins (IHME); Drs Rob Moss, Nic Geard, Patrick Andersen and Tim Wilson (University of Melbourne), assisted by all members of the Population Interventions Unit (Drs Driss Ait Ouakrim and Laxman Bablani, and Profs Vijaya Sundararajan and Tony Blakely).
- The determination of which diseases and conditions are impacted by COVID-19 restrictions, and with what magnitude, was undertaken by Dr Driss Ait Ouakrim, Ms Ameera Katar, Mr Patrick Abraham, Dr Natalie Carvalho and Prof Nathan Grills.
- Overall leadership of the body of work was by Prof Tony Blakely.
- Web hosting and technical support was provided by Grace Dong and Dr Melissa Makin.
- We acknowledge a generous anonymous philanthropic grant, through Advancement, that enabled this project.
Contact Details
Please direct media or other enquiries about this research to the Population Interventions Unit at the following address.